



Steam System Efficiency Calculation: Key Inputs That Change the Result




Steam System Efficiency Calculation: Key Inputs That Change the Result
Steam system efficiency calculation is only as reliable as the numbers feeding it.
A clean spreadsheet can still produce a misleading answer.
That usually happens when pressure, load, heat loss, or condensate data are simplified too much.
In daily plant work, those small assumptions move the final percentage more than many people expect.
A practical steam system efficiency calculation should reflect how the system actually runs, not how it looks on a design drawing.
This matters for troubleshooting, benchmarking, fuel planning, and routine energy reviews.
It also matters when teams compare one boiler house, production line, or operating shift against another.
At GTC-Matrix, this issue appears often across industrial cooling, heat exchange, and thermal utility systems.
The stronger signal is simple: better inputs produce better energy decisions.
Why the Same System Can Show Different Efficiency Results
Many teams expect one fixed answer from a steam system efficiency calculation.
Real systems rarely behave that way.
Steam demand rises and falls.
Fuel quality shifts.
Ambient conditions change boiler performance, stack loss, and blowdown requirements.
Instrumentation drift adds another layer of error.
This is why two reports can describe the same steam network and still show different efficiency values.
One calculation may use nameplate steam output.
Another may use measured steam flow from a specific shift.
One may include condensate recovery savings.
Another may ignore them completely.
So before debating the result, check the input boundaries first.
Input 1: Steam Pressure and Temperature
Pressure is one of the biggest variables in any steam system efficiency calculation.
A small pressure shift changes steam enthalpy, density, and usable heat content.
That affects both the energy supplied and the energy delivered.
Temperature matters just as much, especially when superheated steam is involved.
Using saturation values for superheated service can distort the result quickly.
In practice, operators should verify three points:
- Where pressure is measured
- Whether pressure is stable or fluctuating
- Whether temperature represents actual process steam conditions
Header pressure is not always the same as pressure at the end use point.
When calculations use the wrong location, efficiency can look better than reality.
Input 2: Steam Flow and Load Variation
Steam flow is often treated as a stable value, but real plants seldom run at flat demand.
Batch processes, start-stop equipment, and seasonal changes all affect steam consumption.
This means steam system efficiency calculation should use representative load profiles.
A single snapshot can mislead, especially during startup or low-load periods.
Boilers usually perform best near a defined operating window.
Outside that range, cycling losses and excess air can rise.
That is why average daily flow can hide poor efficiency during off-peak hours.
A more useful approach is to compare efficiency under several operating bands.
- Base load
- Normal production load
- Peak demand
- Startup or standby
That gives a clearer steam system efficiency calculation for operations and maintenance planning.
Input 3: Condensate Return Rate
Condensate return has a direct impact on thermal efficiency and operating cost.
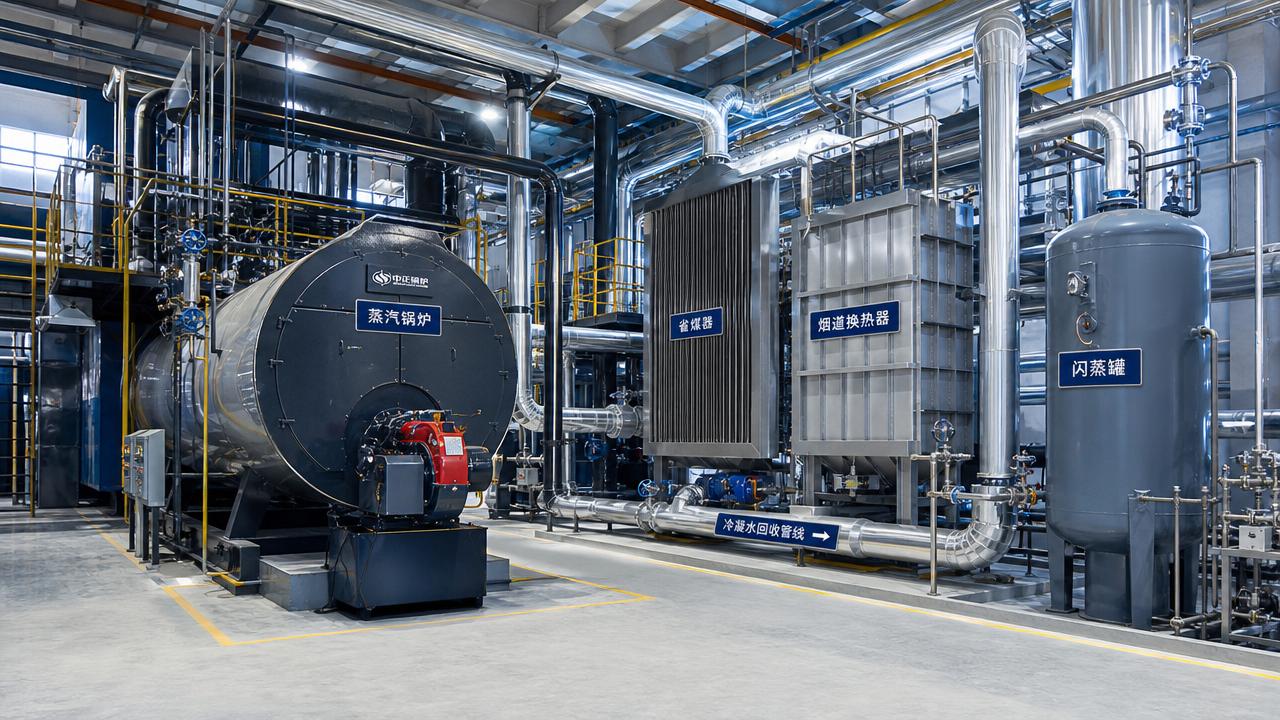
Recovered condensate returns heat, treated water, and chemical value to the boiler system.
If the return rate is overstated, the steam system efficiency calculation becomes inflated.
If it is understated, energy-saving potential may be missed.
The issue is not only percentage return.
Return temperature also matters.
Hot condensate reduces the fuel needed to reach boiler feedwater conditions.
Cold make-up water pushes fuel demand up.
In actual operations, poor trap performance, flash steam loss, and leaks reduce effective recovery.
So measured return data is far better than estimated values from old design documents.
Input 4: Fuel Quality and Combustion Conditions
Fuel input is the denominator in most steam system efficiency calculation methods.
If the fuel heating value is wrong, the whole result shifts.
This problem appears often when plants use supplier average values instead of current laboratory data.
Natural gas composition can change.
Liquid fuel quality can change even more.
Combustion settings are just as important.
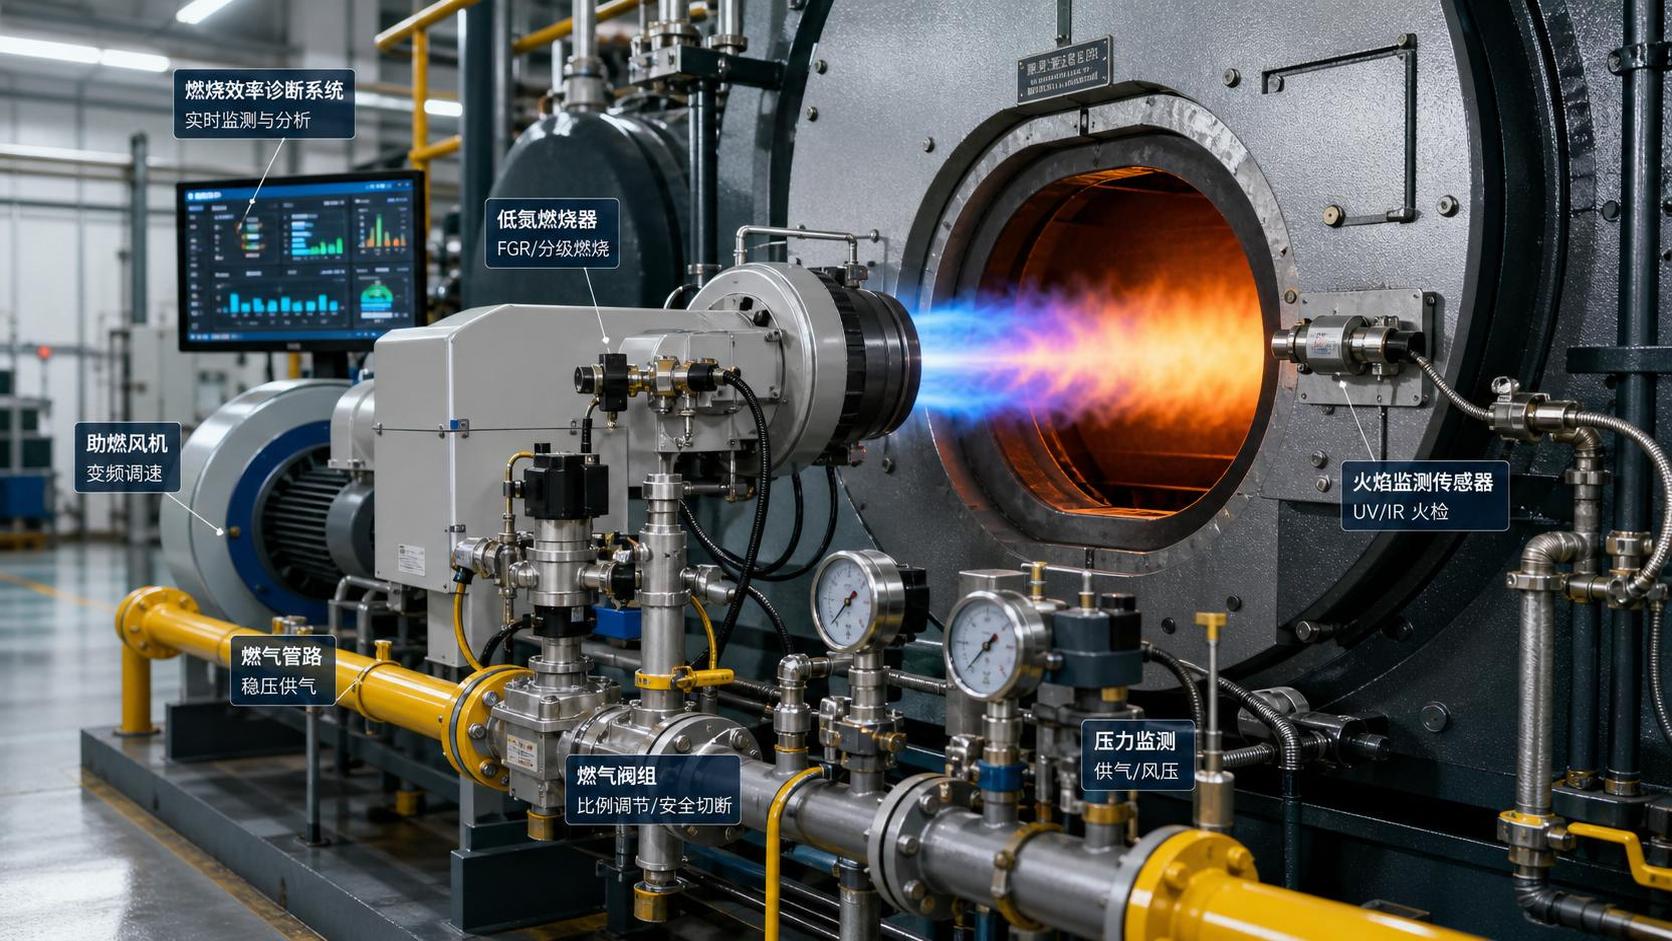
Excess air, burner tuning, and stack oxygen directly influence heat loss.
A boiler can look mechanically healthy while combustion efficiency still drops.
From a technical standpoint, a solid calculation should align fuel flow, heating value, and flue gas data from the same period.
Input 5: Blowdown, Heat Loss, and Distribution Losses
Some steam system efficiency calculation reviews focus only on boiler output.
That leaves out losses across the wider steam network.
Blowdown removes dissolved solids, but it also removes useful heat.
If blowdown rate is higher than required, fuel is wasted every hour.
Then there are radiation losses from uninsulated or damaged surfaces.
Steam leaks and faulty valves add hidden losses too.
Long distribution lines increase pressure drop and reduce delivered energy quality.
These items may seem minor alone, but together they shift the final number noticeably.
This is where a plant-wide steam system efficiency calculation becomes more useful than a boiler-only result.
How Measurement Quality Changes the Result
Bad instruments create bad calculations.
That sounds obvious, yet it remains one of the most common weak points.
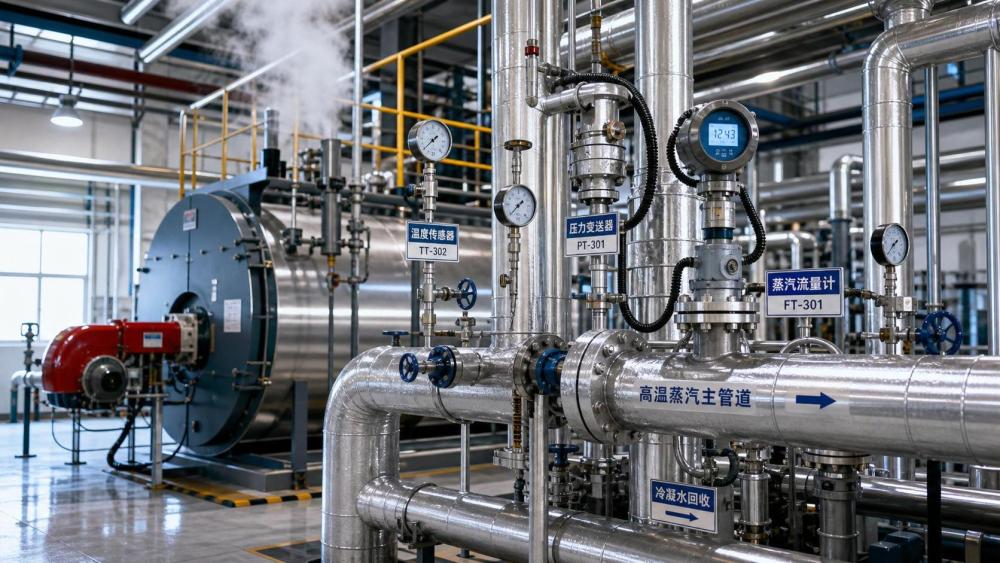
A drifting pressure transmitter or fouled flow meter can distort the whole baseline.
For that reason, measurement confidence should be reviewed before reporting any efficiency figure.
Focus on these checks:
- Calibration date and verification method
- Sensor location versus process objective
- Time alignment between fuel, steam, and condensate data
- Manual estimates used to fill data gaps
A precise steam system efficiency calculation depends on trustworthy measurements more than on complex formulas.
A Practical Input Checklist
Before accepting any steam system efficiency calculation, run through a short field checklist.
What Better Calculations Help You Do
A stronger steam system efficiency calculation supports better decisions across operations.
It helps identify whether the issue sits in combustion, condensate recovery, steam trapping, or load management.
It also improves communication between production, utilities, and maintenance teams.
That matters when energy costs rise or when carbon reduction targets become stricter.
In practical terms, better inputs lead to better priorities.
You can spot false savings claims faster.
You can compare improvement projects on a fair basis.
You can also build a cleaner efficiency trend over time.
That is the real value behind a disciplined steam system efficiency calculation.
Start with the inputs, challenge the assumptions, and let the result earn your trust.
Related News
- Low-NOx Boilers Cost Breakdown: Upfront Price, Fuel Savings, and PaybackAuthor :Thermal Energy Strategist

- Boiler Combustion Systems: Common Causes of Unstable Fuel PerformanceAuthor :Thermal Energy Strategist

- Hot Water Industrial Boilers: When Efficiency Gains Justify ReplacementAuthor :Thermal Energy Strategist

- What Boiler Efficiency Really Means in Daily Operation and Energy BillsAuthor :Thermal Energy Strategist

- Boiler Efficiency Testing Methods That Expose Heat Loss and Fuel WasteAuthor :Thermal Energy Strategist

- Industrial Burner Systems: Key Factors for Safe Heat OutputAuthor :Thermal Energy Strategist

- Gas-Fired Boiler Combustion Technology: Key Efficiency and Emissions Trade-OffsAuthor :Thermal Energy Strategist

- Unfired Heat Recovery Steam Generators: When Do They Pay Off?Author :Thermal Energy Strategist

- How to Evaluate Steam Generation Systems Electric for Process Heat ProjectsAuthor :Thermal Energy Strategist

- Thermal Power Systems for Industrial Heating: Common Sizing Mistakes to AvoidAuthor :Thermal Energy Strategist

- Low-NOx Condensing Boilers: How to Compare Efficiency and EmissionsAuthor :Thermal Energy Strategist
![]()
- Low Emissions Boilers for Food Processing: Key Compliance and Fuel Cost FactorsAuthor :Thermal Energy Strategist

- Steam System Efficiency Calculation: Key Inputs That Change the ResultAuthor :Thermal Energy Strategist

- How to Evaluate a Steam Boiler Components Exporter Before OrderingAuthor :Thermal Energy Strategist

- Burner Systems Troubleshooting: Common Efficiency Loss CausesAuthor :Thermal Energy Strategist

- EU PED Q2 Rules Require Digital Compliance TagsAuthor :Thermal Energy Strategist

- Thermal Power Systems: Key Efficiency Risks in Daily OperationAuthor :Thermal Energy Strategist

- Low-NOx Combustion Boilers: Key Efficiency and Compliance ChecksAuthor :Thermal Energy Strategist

- Low-NOx Combustion Boilers: Key Specs That Affect Emissions and Fuel UseAuthor :Thermal Energy Strategist

- Low-NOx Combustion Boilers: Key Compliance RisksAuthor :Thermal Energy Strategist

- Thermodynamics Analysis for Boiler Heat-Loss ReductionAuthor :Thermal Energy Strategist

- Industrial Thermal Systems: Common Operating RisksAuthor :Thermal Energy Strategist

- Low-NOx Combustion Boilers: Key Spec Checks Before PurchaseAuthor :Thermal Energy Strategist

- How Industrial Heat Recovery Cuts Boiler Fuel Costs in 2026Author :Thermal Energy Strategist

- Thermodynamics Analysis: 5 Heat Loss Clues in Steam BoilersAuthor :Thermal Energy Strategist

- Low-NOx Combustion Boilers: What Affects Real Emissions PerformanceAuthor :Thermal Energy Strategist

- Thermodynamics Analysis: Finding Heat Loss in Steam BoilersAuthor :Thermal Energy Strategist

- 2026 Steam Boiler Upgrades for Lower NOx and Fuel CostsAuthor :Thermal Energy Strategist

- EU to Expand CBAM to Steam Boilers; Exporters Must Prepare Carbon DataAuthor :Thermal Energy Strategist

- Industrial Heat Recovery: When Payback Beats New Boiler CapacityAuthor :Thermal Energy Strategist

- Carbon Neutrality Targets and the New Boiler Retrofit PaybackAuthor :Thermal Energy Strategist

- Low-NOx Combustion Boilers: Fuel Savings vs Emission LimitsAuthor :Thermal Energy Strategist

- Industrial Energy Efficiency Benchmarks for Steam Boiler Upgrades in 2026Author :Thermal Energy Strategist

- Low-NOx Combustion Boilers: Efficiency vs Emissions in 2026Author :Thermal Energy Strategist

- Industrial Heat Recovery Options for Steam Boiler SavingsAuthor :Thermal Energy Strategist

- Low-NOx Combustion Boilers and 2026 Compliance PressureAuthor :Thermal Energy Strategist