



What Data Is Needed to Assess Heat Recovery Decarbonization?




Assessing decarbonization from heat recovery starts with a disciplined question: what heat is available, when is it available, at what temperature, and which carbon-intensive energy source will it actually replace? A heat-recovery calculation based only on annual recovered kilowatt-hours can look convincing while overstating emissions reductions. The usable result depends on the match between the source, the heat sink, the utility baseline, and the operating calendar.
The required data falls into two linked groups. The first establishes the physical energy balance: flow, temperature, pressure, composition, runtime, and heat-transfer constraints. The second establishes the avoided-emissions balance: displaced fuel or electricity, conversion efficiency, emissions factors, auxiliary power, and the expected life of the equipment. Both groups must use the same boundary and time period.
Start with a defensible energy baseline
Before estimating recovered heat, document how the receiving process is heated today. Identify each existing heat source: steam, direct-fired gas, thermal oil, electric resistance, district heat, or another utility. Record the annual and interval-level energy use, not merely a monthly total. A monthly gas bill may show the scale of consumption, but it cannot prove that a heat-recovery source is available during the same hours that demand occurs.
The baseline should distinguish process heat from space heating, domestic hot water, equipment standby losses, and seasonal loads. For example, compressor cooling heat used for building heating can appear highly valuable in a winter-only calculation, yet provide little annual displacement if compressor operation continues through warm periods after the heating demand ends. Conversely, a stable wash-water or boiler-feedwater demand can often accept lower-grade heat across a much larger share of the year.
For each target load, collect:
- Historical utility consumption, preferably separated by fuel meter, production line, or end use where metering permits.
- Required supply temperature, return temperature, peak duty, and normal duty. The return temperature often determines whether direct recovery is feasible.
- Load duration by hour, shift, day, and season, including shutdowns, maintenance windows, and production campaigns.
- The current equipment efficiency at the point of use, such as boiler seasonal efficiency, burner efficiency, electric heater efficiency, or steam-distribution losses.
- Control setpoints and operational minimums that limit how much conventional heating can be turned down.
A baseline also needs to show whether displaced energy is truly marginal. If a central boiler must remain hot to serve another load, reducing one branch of demand may not reduce fuel use in direct proportion to recovered heat. Boiler turndown limits, cycling losses, steam pressure requirements, and minimum circulation rates can all reduce actual fuel displacement. The assessment should model the conventional system at its revised operating point rather than applying its nameplate efficiency to every recovered unit of heat.
Measure the heat source as a time series
Waste heat is not a single value. It changes with production rate, ambient conditions, compressor loading, refrigeration capacity, pressure ratio, cooling-water conditions, and control actions. A design based on one favorable spot measurement commonly oversizes the heat exchanger or overstates annual carbon savings.
At a minimum, capture source-side inlet and outlet temperatures, fluid flow rate, pressure, operating hours, and periods of reduced or absent load. Where a gaseous or contaminated stream is involved, include composition, moisture, particulates, oil carryover, corrosive constituents, and dew-point behavior. Those properties affect the recoverable duty and determine whether a plate exchanger, shell-and-tube unit, air-to-liquid coil, intermediate loop, or another arrangement is appropriate.
For liquid streams, recovered thermal power is calculated from mass flow, specific heat capacity, and the achievable temperature drop. For air streams, humidity and the possibility of condensation matter. Condensing moisture can release additional heat, but it also introduces drainage, corrosion, fouling, and material-selection requirements. Treating a condensing exhaust stream as dry air will understate recoverable duty; assuming condensation without confirming temperature and dew point will overstate it.
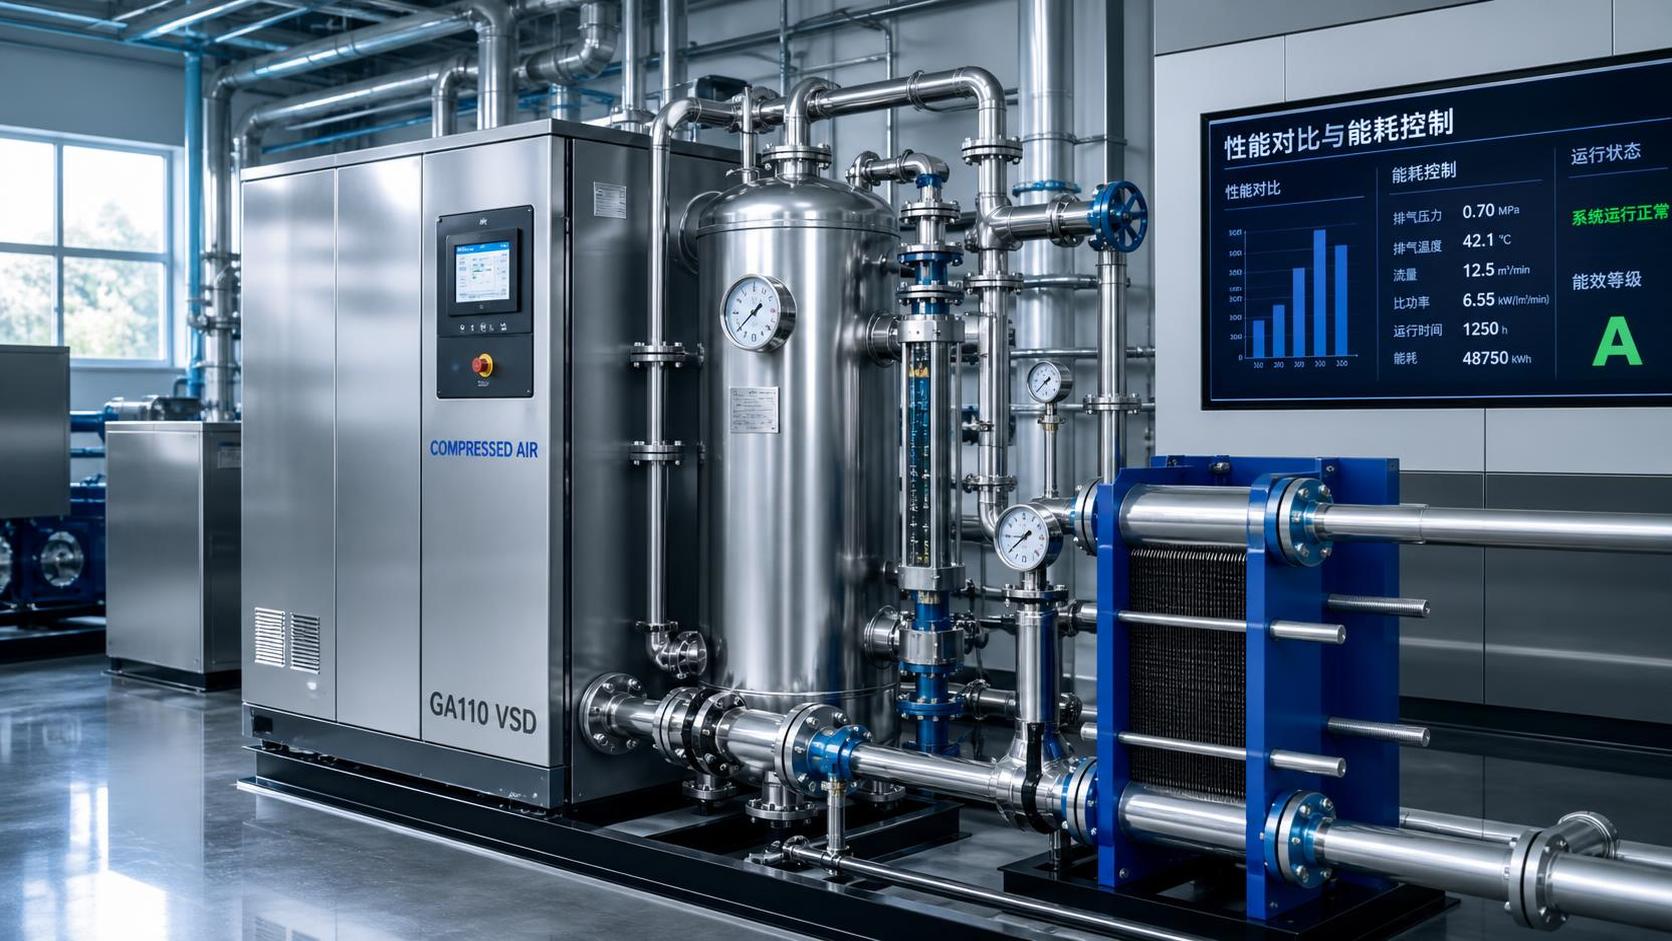
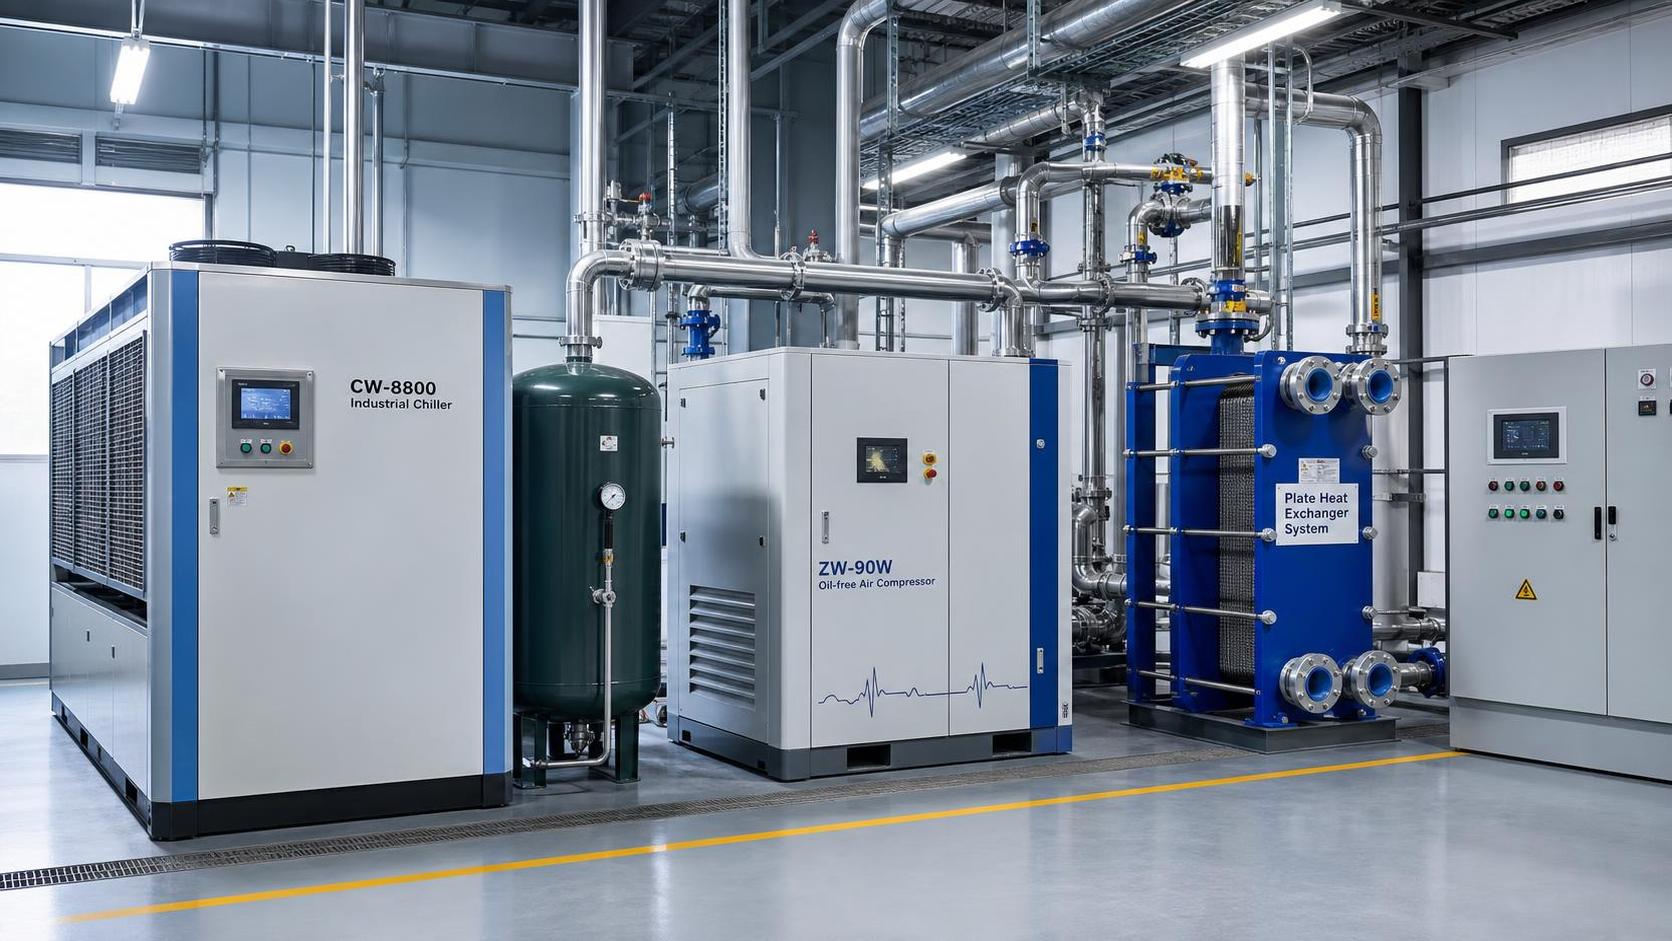
Electrical input data is particularly useful for compressors, vacuum pumps, chillers, and refrigeration systems because it provides a cross-check on the thermal balance. Much of the electrical energy entering such equipment eventually appears as heat, but not necessarily at a temperature or location that a target load can use. Metered electrical load, cooling-loop temperatures, and cooling-loop flow together reveal whether the calculated recovery potential is physically plausible.
Temperature quality determines displacement
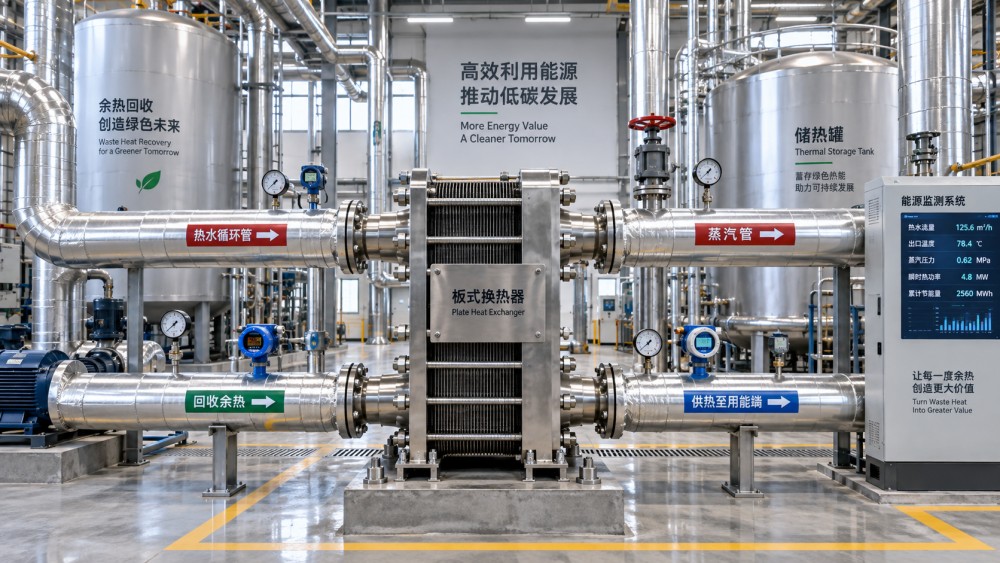
Heat quantity and heat quality are separate issues. A large source at 35°C may be valuable for preheating make-up water, but unsuitable for a process needing 75°C supply. Raising that heat with a heat pump can expand its usefulness, though the heat pump's electricity consumption, seasonal performance, refrigerant management, and peak electrical demand must then become part of the carbon calculation.
Build a temperature map for both source and sink. Include source inlet and outlet temperatures, desired sink inlet and outlet temperatures, design temperature approach, and the minimum approach expected after fouling. Do not assume that a source can be cooled to the sink's entering temperature. Heat exchangers need a temperature driving force, and the terminal approach may be constrained by heat-transfer area, fluid properties, pressure drop, and control stability.
Temperature data should be paired with flow data at the same timestamps. A high source temperature at low flow may deliver less energy than a lower-temperature stream at high flow. Likewise, a heat sink can have a high nominal demand but little acceptance capacity when its control valve closes or its storage vessel reaches setpoint.
Establish the actual fuel or electricity displacement
Carbon savings arise from avoided energy, not from recovered heat alone. The calculation therefore needs a clear counterfactual: without the recovery system, what energy would have supplied the same useful heat?
For fossil fuel displacement, collect fuel type, lower or higher heating value basis used by site meters, measured consumption, combustion efficiency, upstream emissions treatment if included in the stated boundary, and the applicable emissions factor source. Keep units consistent. Errors often arise when heat is reported on a useful-output basis while emissions are calculated from fuel-input data, or when gas volume is converted under a different temperature and pressure basis than the utility meter uses.
For electricity displacement, distinguish electric resistance heating from heat-pump heating. One kilowatt-hour of electric resistance heat generally delivers close to one kilowatt-hour of heat at the use point, before distribution losses. A heat pump delivers heat according to its coefficient of performance, which changes with source temperature, delivery temperature, part-load operation, defrost behavior where applicable, and auxiliary equipment. Using a catalog performance value outside its stated temperature conditions can materially distort both avoided electricity and emissions.
Grid emissions factors require special care. An annual average factor is useful for a high-level inventory, but it may not represent the emissions avoided at the hours when a heat pump operates. If interval emissions data is available and the project changes electrical consumption by time of day, match it to the operational profile. State whether the assessment uses location-based grid emissions, a contractual market-based factor, or a marginal operational factor. These answer different questions and should not be mixed within the same total.
Account for the energy required to recover heat
The recovery system has its own energy use. Pumps, fans, controls, water treatment, heat tracing, valve actuators, and heat-pump compressors consume electricity. Pressure drop across a new exchanger may increase pumping duty. A compressor heat-recovery circuit can alter cooling-water temperatures and affect compressor performance. These effects are usually smaller than the recovered duty, but excluding them turns a gross figure into an unsupported net claim.
Measure or estimate auxiliary consumption by operating mode. A circulation pump that runs continuously has a different annual impact from one that follows source availability. Include startup behavior, standby operation, and bypass conditions. The system should also be evaluated when the target heat sink is unavailable: continued pumping and heat rejection during those periods provide no useful displacement.
Thermal losses need a documented basis as well. Pipe length, insulation condition, outdoor exposure, plant-room temperature, valve stations, storage tanks, and intermittent flow affect delivery losses. Long runs are not automatically unsuitable, but their losses and installation complexity should be represented in the balance. A short route with difficult access, hazardous-area requirements, or frequent line isolation may create a different constraint than a longer route in a service corridor.
Use an operating overlap model, not annual averages
Annual source heat and annual sink demand may each be large while their overlap is poor. A time-resolved model, often hourly or shift-based, prevents this error. For every interval, calculate available recoverable heat, sink demand within the usable temperature range, storage availability, conventional energy displaced, recovery-system electricity, and rejected excess heat.
Production data is necessary because equipment load is rarely constant. Include throughput, product mix, batch timing, clean-in-place cycles, ambient weather where it influences heating or cooling, and planned outages. If data historians are incomplete, use targeted logging across representative operating states rather than extrapolating from a short normal-production period.
Thermal storage can improve overlap, but it should not be treated as a lossless bridge between source and demand. Record usable storage volume, temperature stratification, charge and discharge limits, standby losses, sanitary or process-quality restrictions, and the maximum temperature that can be stored without unacceptable scaling or material degradation. Storage may increase utilization of low-grade heat, while adding pumps, controls, footprint requirements, and a different maintenance burden.
Define boundaries before reporting carbon results
A credible result identifies exactly what is included. A site-operational calculation often covers fuel avoided at the facility plus electricity consumed by recovery equipment. A lifecycle calculation additionally considers manufacturing, transport, installation, replacement parts, refrigerant leakage where a heat pump is used, and end-of-life treatment. Neither boundary is inherently wrong; confusion arises when a lifecycle equipment burden is compared with operational savings without labeling the distinction.
Equipment data should include expected service life, major replacement intervals, exchanger material, corrosion allowance, cleaning requirements, refrigerant type and charge where relevant, and maintenance consumables. Water chemistry deserves attention in recovery loops connected to cooling towers, process water, or untreated streams. Scaling, biofouling, oil contamination, and corrosion reduce heat transfer over time, so the annual estimate should reflect a clean-versus-fouled performance assumption and planned cleaning intervals.
Installation data affects both feasibility and lifecycle accounting. Record pipe materials, insulation, supports, lifting access, shutdown duration, tie-in points, drainage, freeze protection, pressure relief arrangements, and control-system integration. An otherwise sound thermal calculation can fail during implementation if tie-ins require a production stop that cannot be scheduled or if the existing network cannot tolerate the added pressure drop.
Reconcile the calculation and preserve the evidence
Before publishing a decarbonization figure, reconcile source heat, delivered heat, auxiliary electricity, rejected heat, and displaced utility energy. The energy balance should remain understandable when reviewed from either direction: measured source conditions should support the recovered duty, and the target-load reduction should support the claimed displacement.
Keep a record of meter locations, sampling intervals, calibration status, data gaps, assumed efficiencies, emissions-factor source, weather normalization method, and any excluded operating periods. Separate measured values from engineering assumptions. This makes future verification easier when production schedules change, a boiler is replaced, grid emissions decline, or exchanger fouling alters the delivered temperature.
The final assessment should present a range where variable conditions materially affect the result, with the reason for the range stated plainly. Heat recovery reduces emissions only to the extent that usable heat reaches a real demand and displaces energy that would otherwise have been consumed. The data collection effort should be organized around proving that chain, interval by interval, rather than around producing the largest theoretical heat-recovery number.
Related News
- How industrial utility systems affect energy costs in process plantsAuthor :

- What Data Is Needed to Assess Heat Recovery Decarbonization?Author :

- Can Waste Heat Recovery Support Carbon Neutrality Targets?Author :

- Is Compressor Heat Recovery Worth the Installation Cost?Author :

- What to verify before choosing a process separation technology supplierAuthor :

- When does process utilities engineering reduce project rework?Author :

- Where thermal efficiency optimization delivers the fastest savings in EuropeAuthor :

- What should you verify before selecting a heat transfer supplier?Author :

- What drives compressed air systems price for industrial projects?Author :

- How an industrial product knowledge comparison guide reduces sourcing riskAuthor :

- When does a procurement specification planning process reduce bid risk?Author :

- When does thermal system optimization for electronics reduce failure risk?Author :

- When high temperature process heating systems justify the higher energy costAuthor :

- How to compare sludge dewatering equipment by cake drynessAuthor :

- What to Check Before Sourcing a Gas Turbine for Distributed Power ProjectsAuthor :

- What drives industrial thermal systems price in large facility projectsAuthor :

- How to build an industrial product comparison chart that speeds up vendor selectionAuthor :

- Vacuum Technology Application Guide for Selecting the Right SystemAuthor :

- What Drives Vacuum Drying Cost in Industrial Procurement?Author :

- What Drives Compressed Air Pricing in Industrial Systems?Author :

- How Procurement Specification Planning Shapes Total Project CostAuthor :

- Compression Technology Guide: How to Compare Efficiency, Pressure Range, and Maintenance NeedsAuthor :

- How to Compare Industrial Separators by Throughput, Purity, and Maintenance LoadAuthor :

- How to Size a Compressed Air Equipment Receiver Tank for Stable PressureAuthor :

- Industrial Equipment Selection Guide: How to Compare Capacity, Duty Cycle, and Operating CostAuthor :

- How to Evaluate an Intellectualization Supplier for Industrial UpgradesAuthor :

- High-Efficiency Manufacturing: Cost Savings vs. Upgrade RiskAuthor :

- Thermal System Optimization Cost: What Drives ROI?Author :

- How to Plan Process Utilities for a Cleanroom Without Costly ReworkAuthor :

- How to Compare Process Heating Suppliers in MexicoAuthor :

- Food Processing Utilities: Common Sizing Mistakes That Raise Energy and Water UseAuthor :

- How to Build Procurement Specification Planning for Industrial EquipmentAuthor :

- OEM Cooperation for Industrial Equipment: Risks, Terms, and Cost PrioritiesAuthor :

- Specification-Oriented Product Resources That Speed Technical ReviewAuthor :

- Industrial Equipment Selection Guide: A Practical Buyer ChecklistAuthor :

- How to Compare Industrial Energy Management Systems by ROIAuthor :