


Global Energy Costs: 2026 Risk Signals to Watch




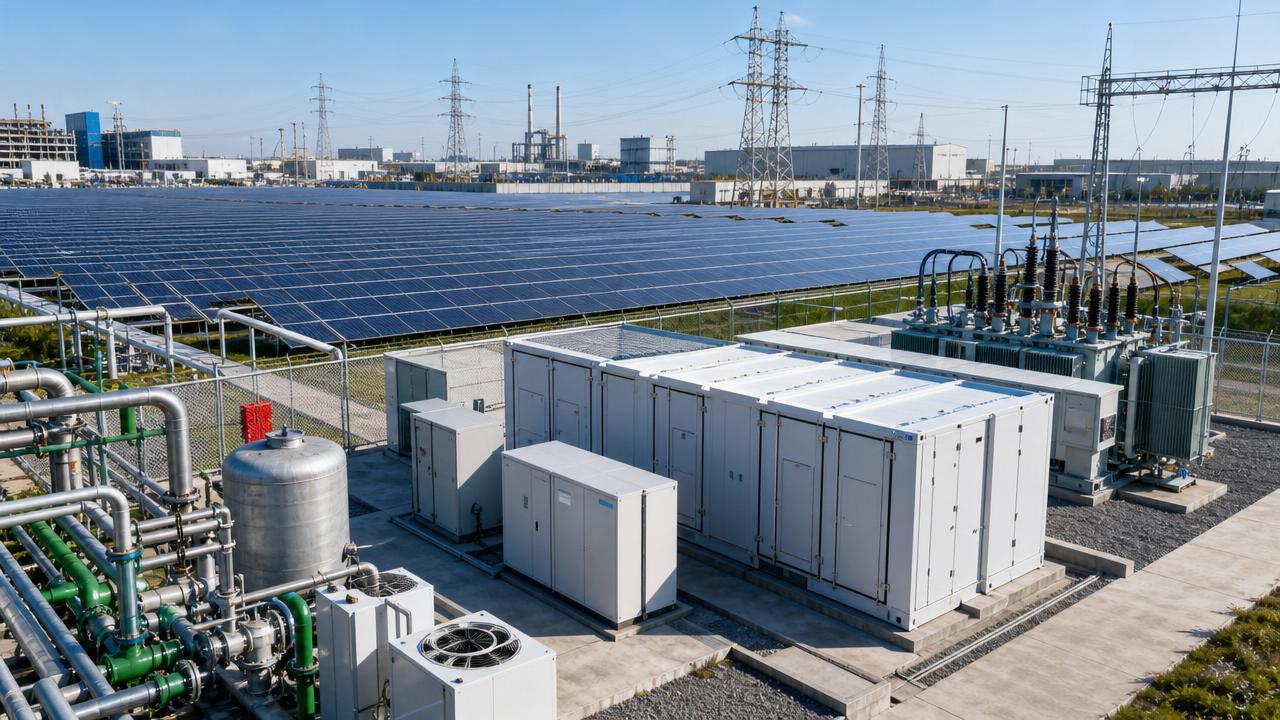
As 2026 approaches, global energy costs are becoming a critical risk signal for enterprise decision-makers managing industrial cooling, compressed air, vacuum, and heat exchange systems.
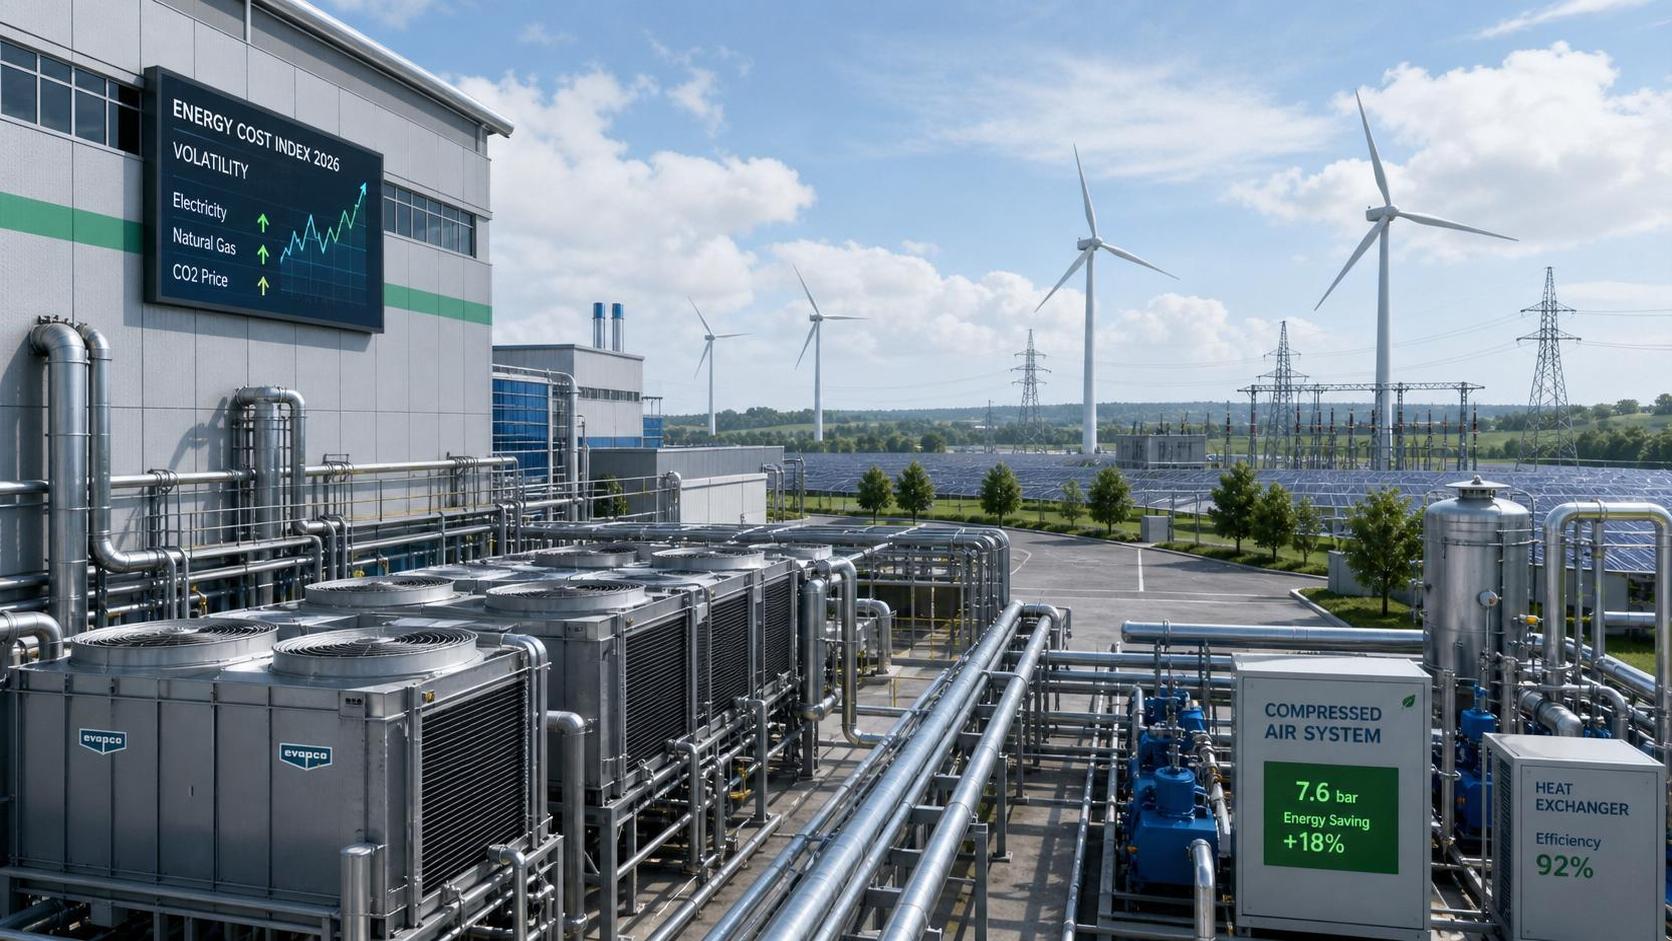
Volatile fuel markets, grid constraints, carbon policies, and efficiency mandates are reshaping operating margins, capital planning, uptime exposure, and industrial competitiveness.
For resilience, the priority is not only tracking prices, but understanding how energy risk moves through thermal and compression assets.
Global Energy Costs: 2026 Risk Signals to Watch
Global energy costs describe the combined expense of electricity, natural gas, oil products, district heat, carbon exposure, and grid-related charges.
In industrial operations, these costs rarely appear as a single invoice line. They are embedded inside cooling load, air demand, vacuum stability, and heat rejection.
A compressor operating at poor part-load efficiency can amplify global energy costs faster than headline electricity prices suggest.
A heat exchanger affected by fouling can convert modest energy inflation into major productivity loss and maintenance pressure.
For 2026, the concern is no longer simple price volatility. The larger issue is interaction among energy markets, policy instruments, and equipment performance.
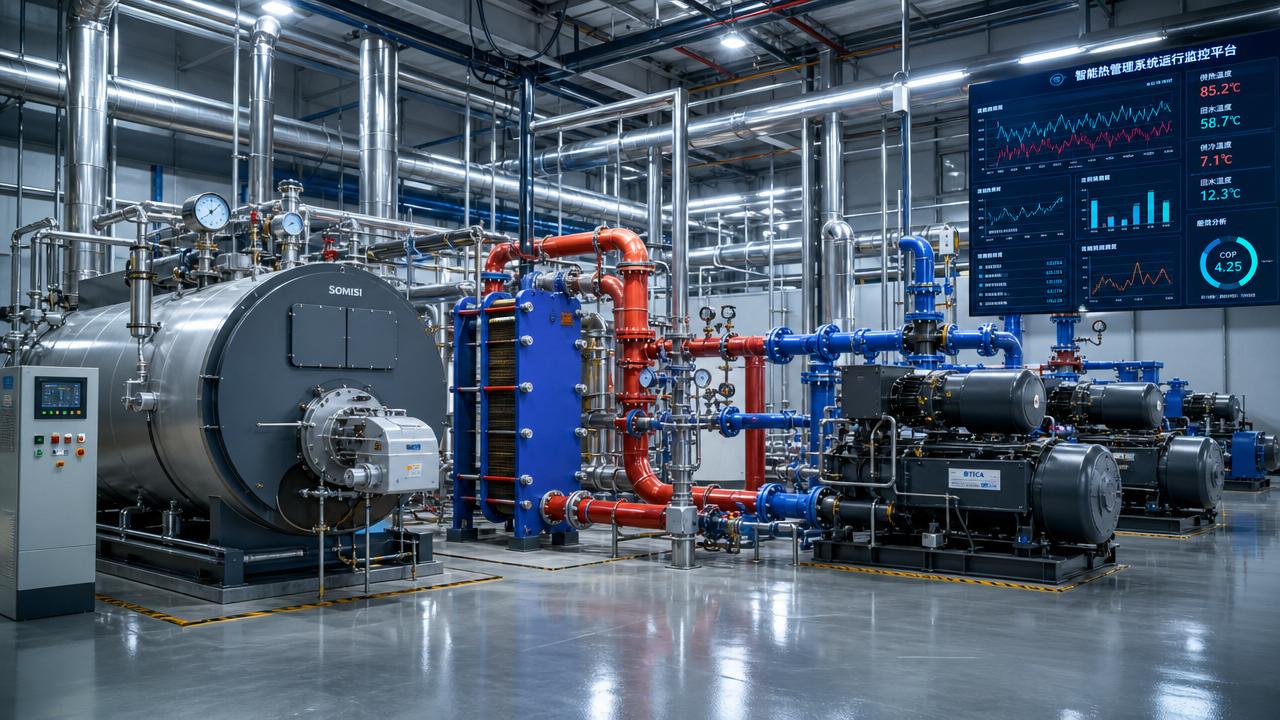
GTC-Matrix views global energy costs through the connection between the “Power Heart” and the “Thermal Center” of modern industry.
This perspective links thermodynamic logic with compression power systems, helping industrial sites identify where financial risk becomes technical risk.
Core Drivers Behind 2026 Energy Cost Risk
Several forces are likely to shape global energy costs in 2026. Each affects cooling, compressed air, vacuum, and heat exchange differently.
Fuel markets remain exposed to geopolitical tension, refinery capacity changes, shipping disruption, and seasonal demand shocks.
Electricity grids face rising demand from data centers, electrified heating, electric mobility, and high-precision manufacturing.
Carbon pricing and emissions reporting are also changing how energy expenses are measured across multinational production networks.
Refrigerant transition policies add another layer, especially for chillers, industrial refrigeration, and heat pump systems.
The table shows why global energy costs should be treated as an operational variable, not only a market indicator.
Why Thermal and Compression Systems Magnify Cost Exposure
Thermal and compression systems often run continuously. Small efficiency losses can therefore create large annual cost impacts.
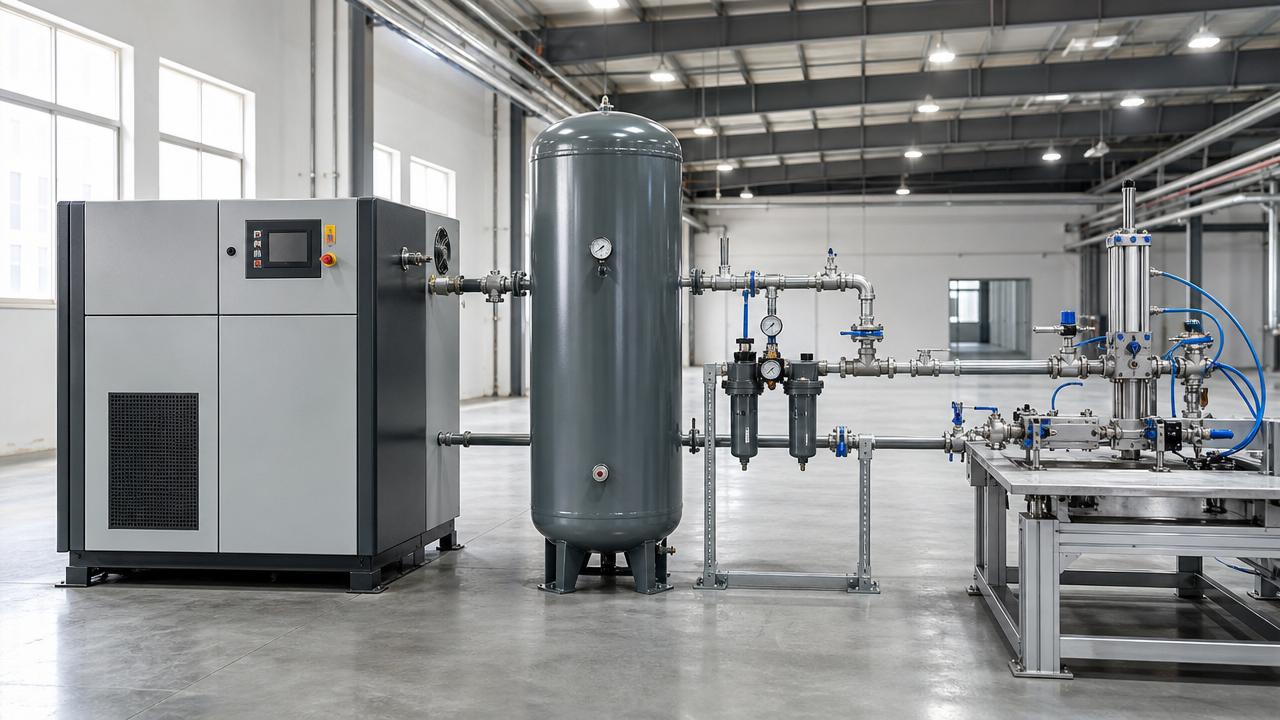
Compressed air is especially sensitive because leaks, artificial demand, pressure oversizing, and poor controls waste electricity invisibly.
When global energy costs rise, every unnecessary bar of pressure becomes a measurable financial penalty.
Industrial cooling faces similar exposure. Chiller efficiency depends on load profile, condenser conditions, pump control, and heat exchanger cleanliness.
A system designed for peak summer load may run inefficiently during most operating hours.
Vacuum processes also convert energy uncertainty into quality risk. Unstable vacuum can affect drying, coating, packaging, and semiconductor processing.
Heat exchange equipment determines how effectively recovered energy is reused before new energy is purchased.
This makes global energy costs a direct measure of hidden waste inside industrial thermal loops.
Current Industry Concerns Across Global Operations
Across sectors, energy planning is becoming less predictable. Long-term contracts no longer remove all exposure to global energy costs.
Tariff structures now include capacity charges, time-of-use pricing, reactive power penalties, carbon factors, and regional grid fees.
Industrial sites also face increasing pressure to document energy intensity per unit of output.
This trend is visible in pharmaceuticals, semiconductors, food processing, chemicals, metals, electronics, logistics, and advanced materials.
- Pharmaceutical production requires stable cleanroom cooling and validated thermal conditions.
- Semiconductor facilities depend on uninterrupted chilled water, vacuum, nitrogen, and compressed air.
- Food industries balance refrigeration, steam, drying, packaging, and hygiene requirements.
- Chemical sites must manage heat recovery, process cooling, and combustion efficiency.
- Logistics networks rely on cold chain resilience during peak electricity pricing periods.
In each case, global energy costs influence both operating expenditure and investment timing.
The most exposed assets are not always the largest machines. They are often assets with poor visibility and constant operating hours.
Business Value of Energy Risk Intelligence
Energy risk intelligence connects market information with engineering decisions. It converts price uncertainty into practical operational priorities.
For GTC-Matrix, this is the function of the Strategic Intelligence Center. It observes cost signals, policy movement, and technology evolution together.
Tracking global energy costs without equipment context can produce misleading conclusions.
A facility with efficient heat recovery may be less exposed than one with cheaper power but poor thermal integration.
A compressed air network with advanced control may absorb tariff volatility better than one running unmanaged baseload compressors.
The business value appears in four areas: cost forecasting, uptime protection, decarbonization planning, and capital allocation.
- Cost forecasting improves when energy intensity is mapped by process, product, and operating mode.
- Uptime protection improves when critical utilities are ranked by energy and reliability exposure.
- Decarbonization planning improves when carbon price and energy efficiency are evaluated together.
- Capital allocation improves when upgrades are compared against realistic 2026 energy scenarios.
This approach helps turn global energy costs from a budget threat into a structured decision signal.
Typical Systems and Risk Profiles
Different systems respond differently to global energy costs. A single percentage increase in electricity prices does not create equal impact everywhere.
This classification supports clearer prioritization. It also prevents investment decisions based only on visible energy bills.
Global energy costs should be evaluated beside load duration, process criticality, maintenance condition, and compliance exposure.
Practical Signals to Monitor Before 2026
A practical monitoring framework should combine market, policy, grid, and asset indicators.
Market indicators include power futures, gas hub prices, oil volatility, LNG availability, and regional fuel switching patterns.
Policy indicators include carbon market reforms, refrigerant quota changes, efficiency standards, and industrial electrification incentives.
Grid indicators include peak pricing, demand charges, curtailment notices, interconnection delays, and reliability reports.
Asset indicators include specific energy consumption, pressure stability, temperature approach, fouling rate, and operating hours.
- Compare energy intensity across shifts, products, seasons, and operating modes.
- Separate baseload demand from variable process demand.
- Track compressor specific power under real production conditions.
- Monitor chiller coefficient of performance at partial load.
- Measure heat exchanger approach temperature and pressure drop.
- Model energy budgets under high, medium, and low price scenarios.
These signals reveal whether global energy costs are being absorbed, transferred, or amplified by industrial assets.
Technology Pathways for Cost Resilience
Technology choices should target both efficiency and flexibility. The best response to global energy costs is not always equipment replacement.
Control optimization can deliver fast gains where compressors, pumps, fans, and chillers operate against outdated assumptions.
Oil-free compression may reduce contamination risk while supporting applications requiring pure, stable air supply.
Microchannel heat exchangers can improve heat transfer density and reduce refrigerant charge in selected applications.
Low-NOx boilers and heat recovery units can support compliance while reducing fuel intensity.
Digital monitoring makes cost risk visible, especially when linked with production data and maintenance history.
The strongest pathway combines operational discipline, engineering upgrades, and energy market intelligence.
Implementation Notes for Industrial Energy Planning
Energy planning for 2026 should begin with a clear baseline. Without it, global energy costs remain abstract and difficult to manage.
The baseline should identify where energy enters, where it is transformed, where it is rejected, and where it can be recovered.
Next, critical systems should be ranked by energy intensity, reliability importance, carbon exposure, and upgrade feasibility.
Short-term actions can include leak repair, setpoint review, heat exchanger cleaning, insulation checks, and control sequence tuning.
Medium-term actions can include variable-speed drives, compressor sequencing, chiller plant optimization, and heat recovery integration.
Long-term actions can include electrification, low-carbon heat, advanced refrigeration architecture, and lifecycle-based equipment selection.
- Avoid evaluating projects only by simple payback under current tariffs.
- Include demand charges, carbon costs, refrigerant risk, and maintenance impact.
- Use scenario ranges to test exposure to global energy costs.
- Protect process stability while reducing unnecessary energy consumption.
This sequence helps reduce uncertainty while keeping investments aligned with production and compliance requirements.
Next Steps for 2026 Readiness
Global energy costs will remain a defining variable for industrial profitability, resilience, and technology strategy in 2026.
The most effective response is structured visibility across markets, policies, equipment behavior, and process demand.
Start by mapping the largest thermal and compression loads, then connect each load to tariff exposure and operational criticality.
Review efficiency opportunities before volatility becomes a budget shock. Prioritize assets that run continuously or influence product quality.
GTC-Matrix will continue monitoring global energy costs, refrigerant policy, compression technology, heat exchange trends, and industrial decarbonization signals.
Thermal Driving Industry, Intelligence Connecting Power remains the guiding principle for building stronger energy decisions.
For 2026, the practical action is clear: measure energy transformation, model cost scenarios, and convert intelligence into resilient system performance.
Ready when you are. Send us a message to get started.
Related News
- Carrier Plans $600 Million Manufacturing and Engineering Center in Fort WorthAuthor :

- Semiconductor Thermal Management: Low Vibration Design PrioritiesAuthor :

- Thermal Interface Materials: What Drives Real Thermal OptimizationAuthor :
![]()
- Global Energy Costs in Europe: What Changed in 2026Author :

- Smart Device Thermal Management: Common Failures and FixesAuthor :

- Thermal Efficiency Optimization: 5 Signs Your System Is Losing HeatAuthor :

- How Precision Temperature Control Systems Improve Process StabilityAuthor :

- How Intellectualization Improves Process Visibility in Modern PlantsAuthor :

- Global Energy Costs in 2026: What Rising Prices Mean for Plant PlanningAuthor :

- Carbon Neutrality Roadmaps: Common Gaps in Industrial PlanningAuthor :

- Heat Transfer Basics: What Affects Efficiency in Industrial EquipmentAuthor :

- Industrial Thermal Systems: Common Failure Risks in Continuous OperationAuthor :

- Global Energy Costs: 2026 Risk Signals to WatchAuthor :

- Pneumatic Power Systems: Common Sizing Mistakes to AvoidAuthor :

- How Thermal Power Systems Cut Downtime in 2026Author :

- Clean Energy Technology Trends Reshaping Industry in 2026Author :

- Pneumatic Power Systems: Key Checks Before Equipment SelectionAuthor :

- Compression Technology Mistakes That Raise Maintenance RiskAuthor :

- Clean Energy Technology Risks to Watch in 2026 ProjectsAuthor :

- Smart Thermal Systems: 5 Signals Your Controls Are Wasting HeatAuthor :

- How to Size Pneumatic Power Systems for Stable OutputAuthor :

- Pneumatic Power Systems: Key Safety Risks in Daily OperationAuthor :

- Clean Energy Technology Shifts Reshaping Industrial InvestmentAuthor :

- Intellectualization in Industry: What Delivers Measurable Value?Author :

- Thermal Management Mistakes That Shorten Equipment LifeAuthor :

- Clean Energy Technology Options That Fit Real Manufacturing UpgradesAuthor :

- Energy-Saving Technologies Worth Tracking in 2026Author :